NFL Underdogs are Outperforming Expectations in Close Games
October 18, 2019 – by Jason Lisk
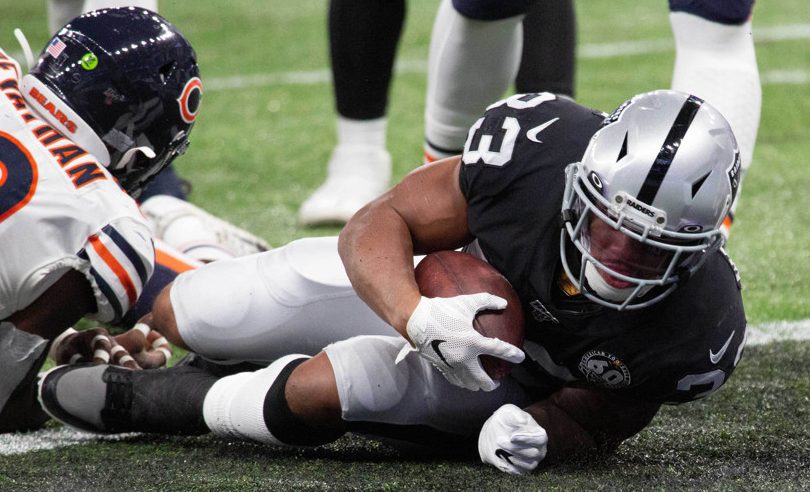
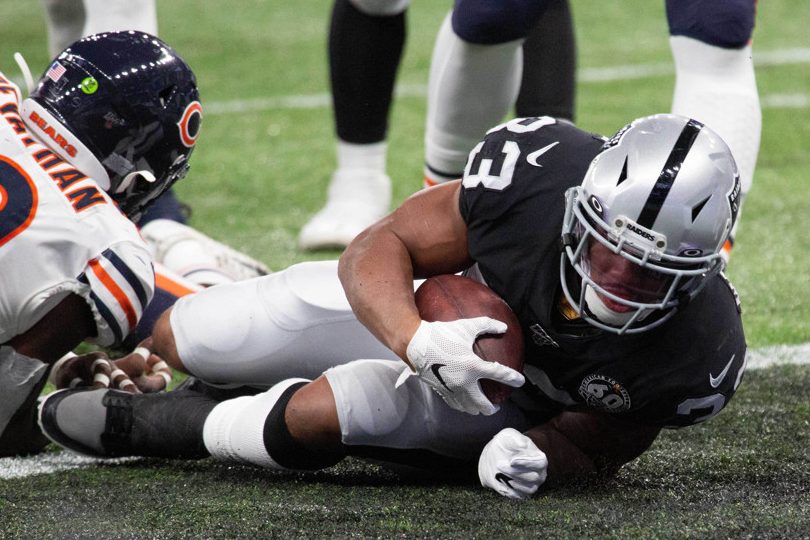
The Raiders are 3-0 in close games as an underdog (Photo by Martin Leitch/Icon Sportswire)
NFL Underdogs are off to a great start in the win column for 2019. Favorites are only 53-38-1 through the first six weeks of the 2019 NFL season (58.2%). Considering that there have been some really large lines so far, and that teams favored by 13 or more have gone 8-0, taking most favorites has been a dicier proposition. In fact, teams favored by less than 7 points had a losing record through the first six weeks: 33-35-1.
Is that because up is down this year, and the oddsmakers just don’t know what they are doing? Not likely.
As it turns out, the best explanation comes from looking at records in close games.
Close Game Performance and the Spread
Before getting to this season, let’s talk about close game performance in general. Win-loss record in close games, let’s say one-possession games where the final score margin is 8 points less, tends to fluctuate somewhat randomly. There is no correlation between winning percentage in close games in the first half of the season and the second half of the season, for example (using data from 2010 to 2018).
However, that doesn’t mean that every team has the same chance of winning a close game. Favorites tend to win a higher percentage of close games. That percentage climbs based on how many points a team is favored. Here is a summary of the win percentage in close games for the period 2010 to 2018, based on spread.
| Team Favored by | Wins by 8 or Fewer | Losses by 8 or Fewer | Ties | Close Game Win Pct |
|---|---|---|---|---|
| 1 to 2.5 points | 156 | 138 | 2 | 0.530 |
| 3 to 4.5 points | 237 | 180 | 2 | 0.568 |
| 5 to 6.5 points | 105 | 61 | 1 | 0.632 |
| 7 to 8.5 points | 88 | 52 | 1 | 0.628 |
| 9 to 10.5 points | 63 | 30 | 0 | 0.677 |
| 11 to 12.5 points | 21 | 4 | 0 | 0.840 |
| 13 or more points | 25 | 5 | 1 | 0.823 |
Bigger favorites tend to be the better teams. They often have the better passing attacks. They tend to be home teams so have the crowd behind them in the crucial last moments. All of these things add up so that even in a close contest where a smaller number of plays are deciding the outcome, it’s not a true toss-up. Plus some of these one-possession games are actually instances where one team was ahead by two scores and allowed a meaningless late touchdown. That should obviously happen more often to bigger favorites than to small ones.
The 2019 Results
Let’s take the recent historical win rates in close games by point spread, and apply them to the close games from the 2019 season. Doing that, favorites would have been expected to win 30.9 out of a possible 52 games decided by one score.
Their actual close game record is 23-28-1 through the first six weeks of 2019.
That works out to a difference of 7.4 wins below expected (counting the tie as a half-win) so far in close games.
Now, looking at all games rather than just close games, we can use the implied win odds based on closing money lines to p out the expected overall records of favorites. Doing that, we see that favorites would have been expected to win 61.7 of 92 games for season. They are actually 53-38-1 across all NFL games through the first six weeks.
Again, counting the tie as a half-win, the overall difference between expected performance and actual performance is 8.2 wins below expected. The close game records account for nearly the entire difference this year. 90% of the additional underdog wins have come in close games.
Visualizing the Difference in Close Game Performance
This chart comes from our Custom Trend Tool. It represents the scoring margin distribution for all games where the spread was between 1 and 6.5 points (2010-2018). There are spikes at key scoring numbers (3, 7, 10, etc) but the overall distribution is shaped like a bell curve with the peak around +3 for the favorites. (This is from the perspective of the favorite, so -10 on the chart represents the number of times a favorite lost by 10 points).
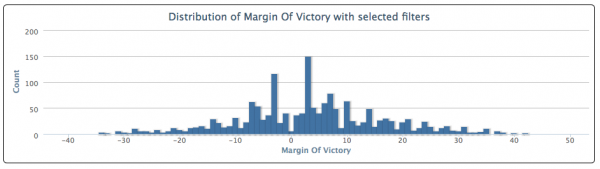
Here is the same scoring margin distribution, but for all games with a spread between 1 and 6.5 points for the first six weeks of 2019.
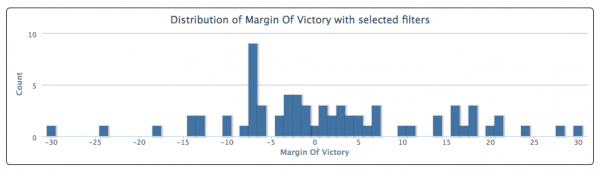
Much smaller sample size, of course, and we see that the number of blowouts are strongly on the side of favorites so far, but the peak of the skewed curve the underdog side. The most common results are at 2-point win, 3-point win, and a big jump at 7-point win for the underdogs.
Who Has Overperformed and Underperformed in 2019 Close Games?
Finally, here is a list of the Top 6 and Bottom 6 teams so far in 2019 by expected versus actual record in close games, adjusted by their point spread status in each game.
| Team | Expect Close Game Wins | Actual Close Game Wins | Difference |
|---|---|---|---|
| New Orleans | 2.5 | 5 | +2.5 |
| Oakland | 1.2 | 3 | +1.8 |
| Seattle | 2.7 | 4 | +1.3 |
| Buffalo | 1.9 | 3 | +1.1 |
| Arizona | 1.5 | 2.5 | +1.0 |
| Green Bay | 2.1 | 3 | +0.9 |
The Saints are 5-0 in close games, and have won 3 of them as the betting underdog. Oakland is a perfect 3-0 in close games and were the underdog in all of them.
| Team | Expected Close Game Wins | Actual Close Game Wins | Difference |
|---|---|---|---|
| LA Chargers | 2.9 | 1 | -1.9 |
| Cincinnati | 1.6 | 0 | -1.6 |
| Dallas | 1.2 | 0 | -1.2 |
| Tennessee | 1.1 | 0 | -1.1 |
| Denver | 2.0 | 1 | -1.0 |
| Cleveland | 1.0 | 0 | -1.0 |
The Chargers have managed to get close in every loss. Considering they have often been the favorite, they have a particularly poor record, going 1-4 in close games. Cincinnati is bucking the underdog trend in close games, as they are 0-4 on the season when a game is decided by 8 or less.
Summary
Underdogs have had their day so far in 2019. The records in close games explains most of the difference between what you would expect and actual results.
Historically, favorites have won more than half of all close games. The magnitude that a team is favored affects not only their overall likelihood of winning, but also their likelihood of winning when the outcome is a close game.
In 2019, favorites are 23-28-1 in games decided by one score, 7.4 wins below the expectation, based on historical results. There’s no reason to expect that massive difference to continue. One would expect those numbers to change and the current underdog advantage to dissipate, as favorites are more likely to have a winning record in close games in the future.
If you liked this post, please share it. Thank you! Twitter Facebook
NFL Football Pool Picks NFL Survivor Pool Picks NCAA Bracket Picks College Bowl Pool Picks College Football Pool Picks NFL Picks NBA Picks MLB Picks College Football Picks College Basketball Picks NFL Predictions NBA Predictions MLB Predictions College Football Predictions College Basketball Predictions NFL Spread Picks NBA Spread Picks MLB Spread Picks College Football Spread Picks College Basketball Spread Picks NFL Rankings NBA Rankings MLB Rankings College Football Rankings College Basketball Rankings NFL Stats NBA Stats MLB Stats College Football Stats College Basketball Stats NFL Odds NBA Odds MLB Odds College Football Odds College Basketball Odds A product ofTeamRankings BlogAboutTeamJobsContact
© 2005-2024 Team Rankings, LLC. All Rights Reserved. Statistical data provided by Gracenote.
TeamRankings.com is not affiliated with the National Collegiate Athletic Association (NCAA®) or March Madness Athletic Association, neither of which has supplied, reviewed, approved or endorsed the material on this site. TeamRankings.com is solely responsible for this site but makes no guarantee about the accuracy or completeness of the information herein.
Terms of ServicePrivacy Policy